How to Read Stock Charts: Beginner’s Guide for Indian Traders
If you’re new to the stock market, learning how to read stock charts is one of the most important skills you can develop. Charts reveal price trends, momentum, and potential reversals — key signals that traders use for entry and exit decisions. This guide is tailored for Indian traders who want to start reading charts with confidence.
What Is a Stock Chart?
A stock chart is a visual representation of a stock’s price movement over time. It shows how the price changes daily, weekly, or monthly — helping you identify trends, patterns, and signals.
Types of Stock Charts
1. Line Chart
- Plots the closing prices over a selected period.
- Simple and good for beginners.
- Not used for detailed analysis.
2. Bar Chart
- Displays open, high, low, and close (OHLC).
- Less commonly used in India.
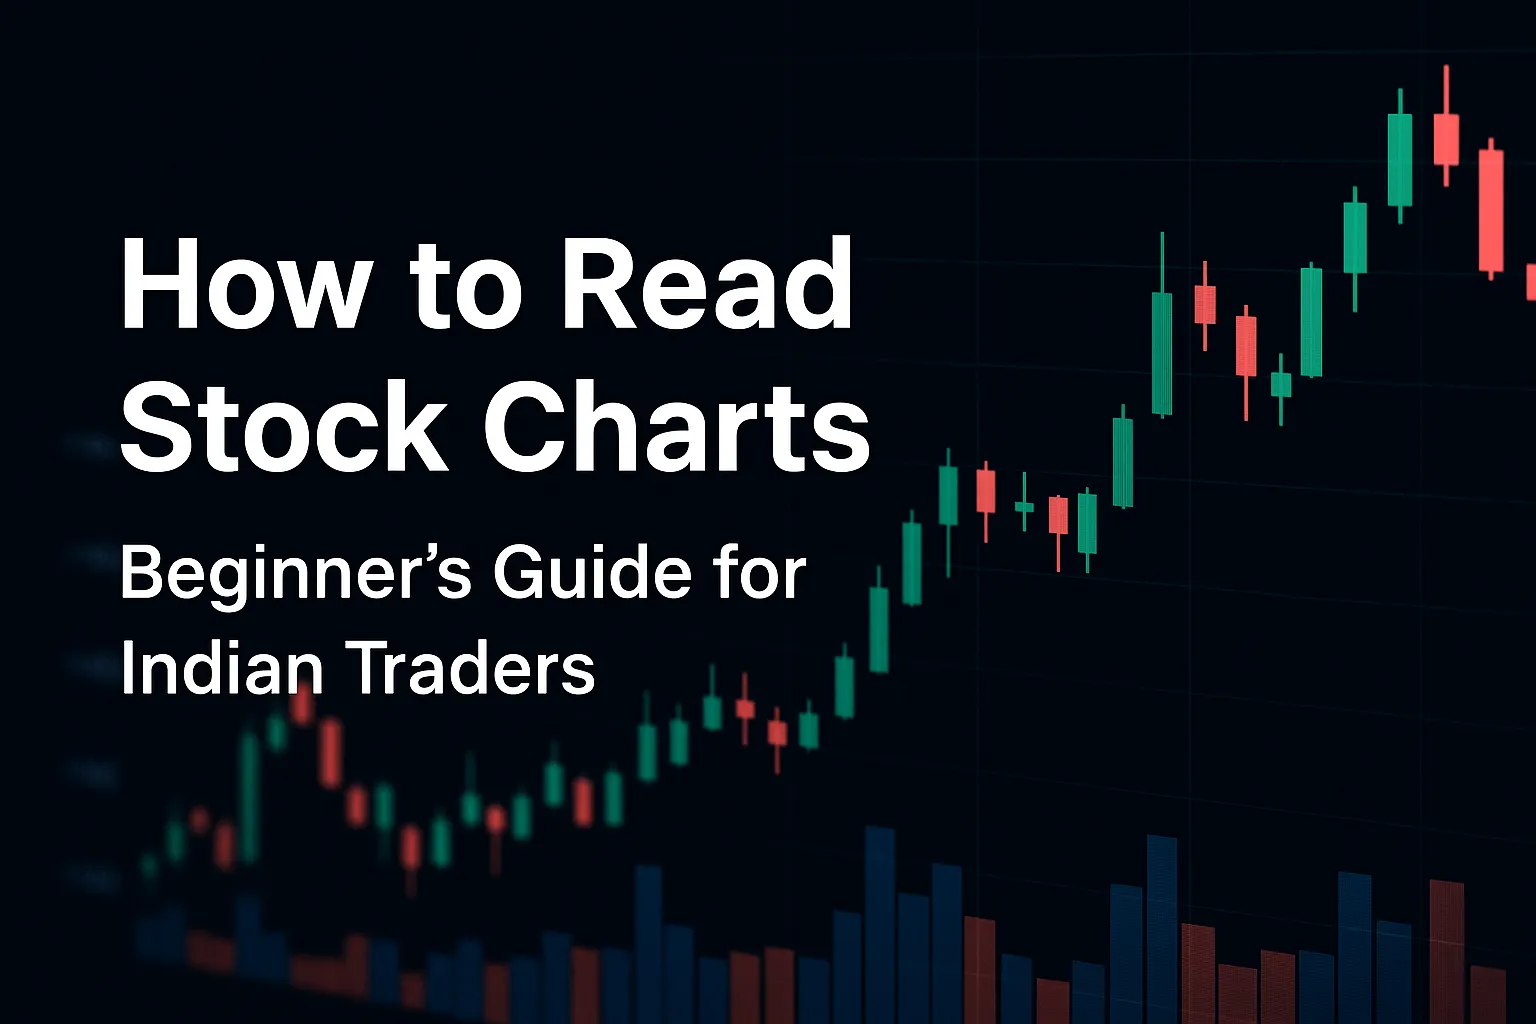
3. Candlestick Chart (Most Popular)
- Each candle shows open, high, low, and close.
- Green = price closed higher than it opened.
- Red = price closed lower than it opened.
Most Indian traders on platforms like TradingView, Zerodha Kite, and Upstox Pro use candlestick charts.
Understanding Timeframes
- Intraday: 1-minute, 5-minute, 15-minute (for day traders)
- Short-term: 1-hour, 1-day
- Long-term: 1-week, 1-month
The timeframe you choose should match your trading style.
Key Chart Components
- Price Axis (Vertical): Stock price
- Time Axis (Horizontal): Date/time
- Volume Bars: Show how many shares were traded
- Indicators: Tools like Moving Averages, RSI, MACD
How to Identify Trends
- Uptrend: Series of higher highs and higher lows
- Downtrend: Series of lower highs and lower lows
- Sideways: Price moves in a range
Use trendlines to draw and confirm these movements.
Simple Chart Reading Techniques
1. Support and Resistance
- Support: Price level where stock usually bounces up
- Resistance: Price level where stock struggles to rise
2. Candlestick Patterns
- Bullish Engulfing: Reversal to upside
- Doji: Indecision, potential reversal
- Hammer/Inverted Hammer: Signs of bottom reversal
3. Volume Analysis
- Higher volume during a price move = more strength behind the trend.
Best Tools to Read Stock Charts in India
- TradingView – Advanced tools & indicators
- Zerodha Kite
- Upstox Pro
- Chartink (for screening + charts)
Final Thoughts
Reading stock charts isn’t about predicting the future — it’s about improving your odds by identifying patterns and market behavior. Start with the basics, focus on one chart type (candlestick), and practice daily by reviewing historical charts and tracking your analysis.
FAQs
1. What is the best chart type for beginners?
Candlestick charts are widely used and beginner-friendly once you learn the basics.
2. Which timeframe is best for intraday trading?
5-minute and 15-minute charts are most common for intraday traders.
3. Can I learn chart reading without paid tools?
Yes, free tools like TradingView and Zerodha offer robust charting capabilities.
4. Are candlestick patterns accurate?
They provide clues, not guarantees. Always use them with volume and trend analysis.
5. Do I need to know technical indicators to read charts?
Not initially. Focus on price movement, trendlines, and volume before adding indicators.


