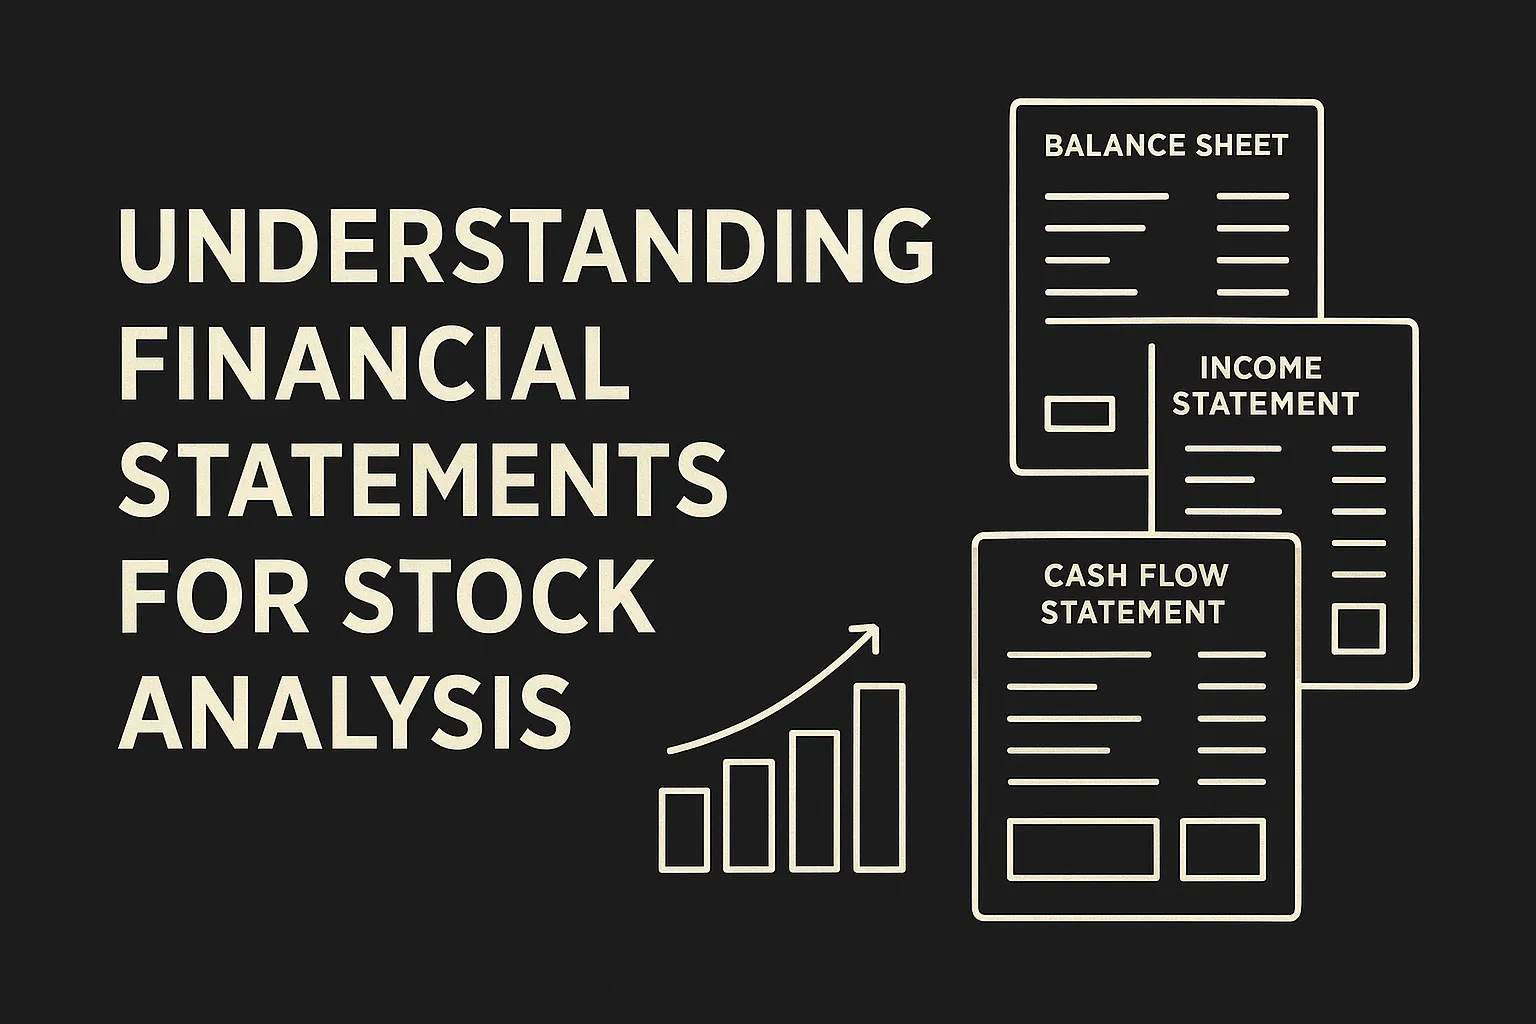
Understanding Financial Statements for Stock Analysis
To become a confident investor in the stock market, understanding financial statements is a must. These documents provide a clear picture of a company’s financial health, performance, and long-term potential. Whether you’re analyzing large-cap stocks or small companies, this guide will help you decode the three main financial statements every investor should know.
Why Are Financial Statements Important?
Financial statements allow you to:
- Measure a company’s profitability and growth
- Compare performance across companies or sectors
- Make data-driven investment decisions
- Avoid fundamentally weak businesses
In India, companies listed on NSE/BSE are required to file financial reports quarterly and annually with SEBI.
1. The Balance Sheet
The Balance Sheet shows a company’s assets, liabilities, and shareholder’s equity at a given point in time.
Formula:
Assets = Liabilities + Equity
Key Sections:
- Assets: What the company owns (cash, inventory, property)
- Liabilities: What the company owes (loans, payables)
- Equity: Net worth (retained earnings + shareholder capital)
What to Analyze:
- Debt-to-equity ratio
- Current ratio (liquidity)
- Asset growth over time
2. Profit & Loss Statement (Income Statement)
This statement shows a company’s revenue, expenses, and net profit over a specific period (quarter/year).
Key Sections:
- Revenue (Sales): Total income from operations
- Expenses: Cost of goods, salaries, taxes, interest
- Profit: Operating profit (EBIT), Net profit (after tax)
What to Analyze:
- Revenue growth
- Operating margins
- Net profit trends
- EPS (Earnings Per Share)
3. Cash Flow Statement
The Cash Flow Statement tracks cash inflows and outflows from operating, investing, and financing activities.
Key Sections:
- Operating Activities: Day-to-day business cash flow
- Investing Activities: Asset purchases/sales, investments
- Financing Activities: Loans, dividends, share buybacks
What to Analyze:
- Positive cash from operations (healthy business)
- High investing outflow (could mean expansion)
- Minimal or managed financing cash flow
Quick Tips for Beginners
- Compare 3–5 years of data to spot trends
- Use ratio analysis (ROE, ROCE, Net Profit Margin)
- Check notes to accounts for important details
- Use platforms like Screener.in, Tickertape, or Moneycontrol for simplified financials
Common Mistakes to Avoid
- Don’t judge only by net profit — check cash flow too
- Avoid companies with consistent negative operating cash flow
- Beware of rising debt without revenue growth
- Don’t ignore management commentary or auditor’s notes
Final Thoughts
Financial statements are your window into how a company operates, grows, and sustains profits. By learning how to interpret them, you can significantly improve your stock-picking decisions and invest with greater confidence in the Indian market.
FAQs
1. Which financial statement is most important?
All are important, but the cash flow statement is often considered most reliable for judging a company’s real financial strength.
2. Can I analyze financial statements without a CA background?
Yes, with basic accounting knowledge and online tools, even beginners can understand key figures.
3. Where can I find Indian company financial statements?
Check the company’s website, NSE India, BSE India, or tools like Screener.in.
4. What is the best ratio to analyze a stock?
It depends on the business, but ROE, Net Profit Margin, and Debt-to-Equity are commonly used.
5. How often are financial statements updated?
Public companies in India publish quarterly and annual results.

